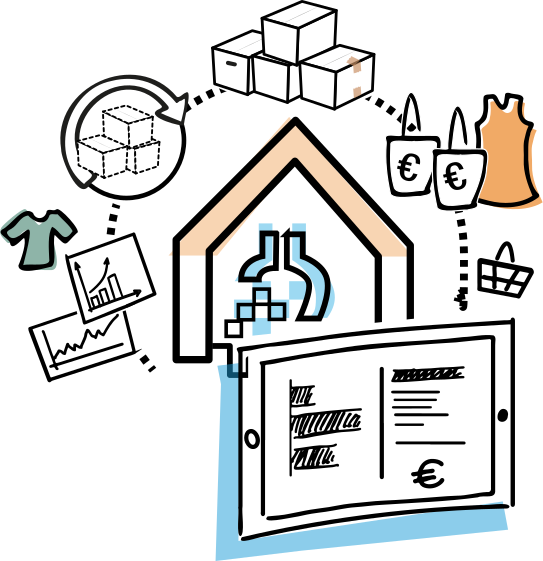
Financial statistics displayed on a tablet during analysis
For CFOs, controllers and finance teams

From Excel limits to finance data you can steer by

Finance teams are often highly capable with Excel, but run into limits when data becomes too large, too manual or too fragmented. Datalab Studio brings financial sources, ERP, CRM, operations and custom software together in one reliable data foundation for reporting, dashboards, analysis and forecasting.

Where finance teams get stuck

Most finance departments do not lack knowledge or effort. The problem usually sits in the number of sources, manual work and differences in interpretation.

Datalab Studio for Finance

A managed data foundation for financial steering

Datalab Studio connects financial sources such as accounting, payroll, invoicing, budgets and consolidations with operational sources such as ERP, CRM, webshop, stock, planning, production, service or custom software. Finance no longer has to keep collecting, checking and remodelling exports.

We understand finance practice. Datalab works for CFOs, controllers, accountancy firms and organisations where margin, cash flow, working capital, revenue, costs and forecast reliability directly guide decisions. We know where Excel is strong, but also when the process becomes too fragile.

The solution is modular. You can start with one reporting process, one dashboard, one data model or one forecasting question and expand later to more sources, teams and applications.

Finance

Combine financial sources reliably

Accounting, payroll, invoicing, budgets, bank data, cost centres, project administration and consolidation come together in one controlled foundation.

Operations

Operational data alongside financial figures

ERP, CRM, stock, webshop, planning, service and custom software show what drives financial performance.

Excel

Less manual work and fewer fragile spreadsheets

Excel remains useful for analysis, but no longer has to be the vulnerable backbone of reporting, definitions and data connections.

Steering

Dashboards, forecasting and analyses finance understands

From monthly reporting and margin analysis to cash flow, working capital, scenarios and early signals.

Applications

Where Datalab Studio strengthens finance

Finance only gains control when financial and operational data are available in context.

1 Reporting

Monthly reporting without endless copying and checking

Many controllers still spend too much time on exports, reconciliations and manual spreadsheet work. Datalab automates the data foundation behind reporting, so figures are available sooner and remain traceable.

This makes month-end calmer and increases trust in management reporting, dashboards and board information.

2 Margin

Margin, costs and revenue in relation to operations

Financial figures rarely explain themselves. To truly understand margin, channel performance, stock, projects or service costs, finance needs to include data from operations, sales and planning.

Datalab connects those sources so CFOs and controllers see not only what happened, but why it happened.

3 Forecast

Better forecasting and scenarios on reliable data

Forecasts become stronger when historical figures, pipeline, stock, capacity and seasonal patterns come together in one model.

We build dashboards, datasets and analyses that help finance steer faster and make assumptions explicit.

4 Collaboration

Finance, operations and management work from the same truth

Debates about definitions cost a lot of energy. What counts as revenue? Which costs belong to which margin? Which forecast version is leading?

With reusable data models, documentation and clear ownership, one foundation emerges that finance, operations and management can trust.

Client cases

Finance data in practice

The existing cases show how finance and operational steering questions come together in different organisations: from retail with many sources and stock movements to smaller organisations that need practical dashboards without a large internal data team.

Collaboration model

Three ways to make finance data more reliable

Datalab connects to the capacity you already have. Some finance teams mainly want a technical data foundation. Others need help making reports, KPIs and analyses substantively sharper.

Optie #1

Platform, connectors and data models

We deliver the data warehouse, source connections, data models, permissions and quality checks. Your own finance, BI or IT team continues building on top of it.

  • For organisations with their own BI or data capacity
  • Strong foundation for reporting, Power BI and Excel analysis
Optie #2

Build finance dashboards and analyses together

We build together with controllers, finance managers, BI specialists and key users. This creates results quickly, while knowledge about sources, definitions and use grows in your organisation.

  • Practical when Excel overload or fragmented reporting slows finance down
  • Suitable when finance and BI need to strengthen each other
Optie #3

From finance question to daily steering

Datalab guides the full programme: sharpen the question, unlock sources, build data models, realise dashboards, take users along and continue developing. Where needed, BPO - De Administratie adds CFO and controller expertise.

  • Also suitable without your own data team
  • From monthly reporting to forecasting and management conversations
Partner

CFO and controller expertise when needed

Sometimes finance data is mainly a technical question: sources need to come together reliably and your own CFO, controller or BI team can continue from there. In that case we keep the project technical and compact.

If that capacity is missing, or your team is already stretched, we can work together with BPO - De Administratie. Datalab provides the data platform, data models and, where needed, BI or analytics support; BPO helps as a part-time CFO/controller with KPIs, sharp definitions, reporting, budget control and the financial interpretation of the figures. The result is not just a working platform, but management information that leadership can actually act on.

In cooperation with BPO - De Administratie

How do we start with finance data?

We start from a concrete reporting or steering question and build from there towards a data foundation that can grow.

1.

Clarify reporting pain and finance questions

We determine where the most manual work, fragility or interpretation difference sits: monthly reporting, margin, cash flow, forecasting, budgets, projects or operational steering.

Resultaat: a concrete finance scope.

2.

Inventory financial and operational sources

We look at accounting, payroll, invoicing, ERP, CRM, webshop, stock, planning, Excel files and custom software. We also assess APIs, exports and data quality.

Resultaat: visibility of feasibility and connections.

3.

Build the data model and definitions

We define how revenue, margin, costs, forecast versions, budgets, customers, products and cost centres are calculated and reused.

Resultaat: one reusable financial truth.

4.

Put dashboards, analyses and routines into use

We deliver reports, dashboards, datasets or forecasts that fit how finance, operations and management make decisions.

Resultaat: less manual work and better management information.

After that, the solution grows with you

5a. Continue independently

Your team builds on the foundation

Finance, BI or IT uses the data model for new dashboards, analyses and Excel models. Datalab remains available for review, management and specialist questions.

5b. Develop together

Datalab keeps building and guiding

We add sources, improve models, build new dashboards or forecasts and help users apply the insights every day.

When the question is not only technical, BPO - De Administratie can add CFO and controller expertise.

Frequently asked questions

Questions about Datalab Studio for finance

Practical answers for CFOs, controllers and finance teams that want to improve their reporting and analysis process.

Is this a finance package or a data platform?

Datalab Studio is a data platform, not a standard finance package. We connect existing systems and build reliable data models, dashboards, reports, analyses and forecasting on top of them. This means it fits your own finance process and operational sources.

Can you work with our existing Excel models?

Yes. We often start with existing Excel reports to understand definitions, calculations and data flows. Then we remove fragile manual steps from the process and make sure Excel is only used where it adds value.

Which financial sources can you connect?

We connect accounting, payroll, invoicing, CRM, ERP, bank, project and budget sources, among others. Think of Exact, AFAS, Nmbrs, Twinfield, Visma and many custom sources. Where standard connectors are missing, we assess API, database, export or custom connector options.

Can operational sources also be included?

Yes. For CFOs and controllers this is often essential. Margin, revenue, stock, service costs, production, planning and sales pipeline only become understandable when operational data sits alongside financial data.

When is BPO - De Administratie relevant?

BPO is relevant when the question needs CFO, controller or finance-content guidance alongside technology. Datalab then builds the data foundation and insights; BPO helps sharpen KPIs, definitions, interpretation and management steering. Read more about the cooperation with BPO.

Which services connect to this?

For the technical foundation, this often connects to Data warehouse setup, Dashboards & BI and Analytics & AI. For temporary expertise, financial data consultancy, Power BI consultancy and DBT & data modelling are relevant.

Make finance reporting more reliable and less manual

Start with one reporting process, one source set or one dashboard. If the foundation is right, finance can keep building step by step.

Schedule a call