Business analysts discussing data at a workstation
For organisations with multiple systems

Data from separate systems, overview of your process

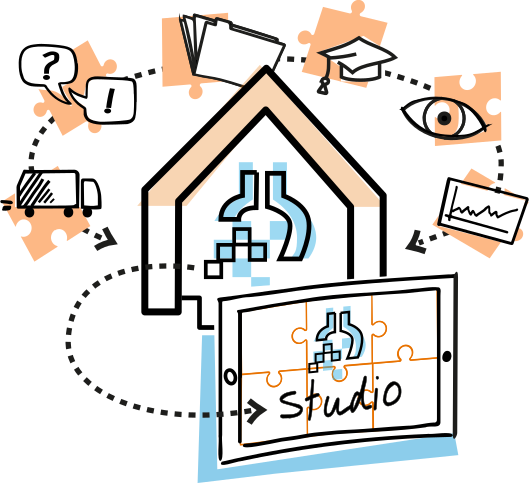
Is your data spread across CRM, ERP, files and your own software? Employees keep making the same exports, departments report different numbers and no one sees where a process slows down. Datalab brings the sources together and builds dashboards for your team's questions. The foundation underneath: Datalab Studio, for organisations with questions across multiple systems and processes.

When Datalab Studio adds value

Not every data question starts with a large programme. Often it starts with one recurring question that no one can answer quickly and reliably.

What is Datalab Studio?

A workable data foundation for your organisation

Datalab Studio is our approach for organisations that want to combine systems and information across different process steps. The core: unlock sources, define definitions, monitor data quality and make insights available to the teams that need to work with them. You do not need to be able to phrase your problem as a data platform question - a recognisable bottleneck in the work is enough.

We combine data from operational systems, sensors, planning software, CRM, finance, service processes, web applications, spreadsheets, databases and external sources. On top of that, we build dashboards, reports, analyses, data products or AI applications that fit the way your organisation makes decisions.

The result is not a standalone dashboard, but a reliable foundation that can grow. You can start small with one source or analysis, and later expand to multiple teams, processes and applications.

Manual work

Reporting keeps taking manual work

Then we build a recurring report assembled from fixed sources, with agreed checks.

Process

We lack visibility of our process

Then we create an overview that connects data from several process steps and makes bottlenecks visible.

Figures

Departments use different numbers

Then we start with one indicator with a recorded definition, source and owner.

AI

We want to do something with AI

Then we explore one task, the data it needs and how the outcome is assessed.

Applications

What you can do with a reliable data foundation?

The form differs by organisation. The underlying question is often the same: how do we make data reliable enough to steer by?

1 Steering

Current management information without manual copying and pasting

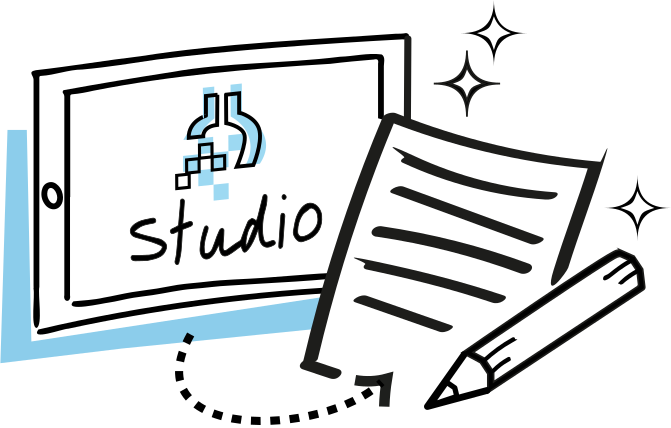
Many reports still come from separate exports, spreadsheet edits and manual checks. That takes time and makes figures fragile. Datalab Studio automates the data foundation behind those reports, so teams can reach current and verifiable information faster.

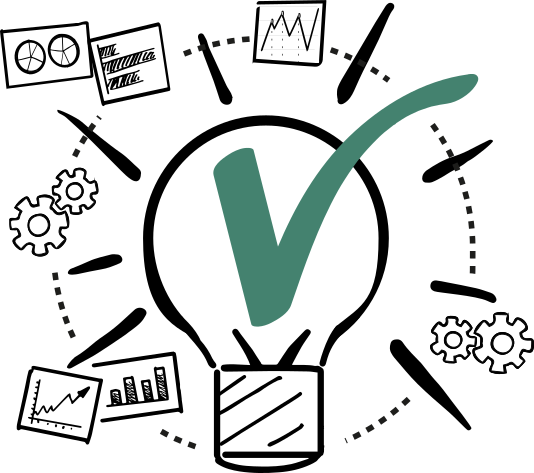
Think of management dashboards, weekly operational reports, project steering, capacity views, quality measurements or commercial progress. The value lies in the same figures, the same definitions and less dependence on manual work.
2 Process

Understand processes by combining data from several steps

Data often becomes valuable only when you can see the chain: request, planning, execution, delivery, service, invoicing and result. If every step lives in a different system, improvement often remains based on assumptions.

An example of a well-scoped first application: a dashboard that connects request date, order status and invoice status. It shows counts and lead times per step, including open exceptions; users see how current the data is and who follows up on deviations. Feasibility depends on the available data and usable keys between the systems - we investigate that up front.

3 Quality

Reliable data as a condition for analysis and AI

AI, forecasting and advanced analytics only work when the underlying data is reliable, traceable and well managed. That is why we do not start with the model, but with the data foundation.

We set up checks for completeness, timeliness, exceptions and definitions. This creates an environment in which analysis does not have to start again each time with cleaning and explanation.

4 Growth

Start small and expand without starting again

A good first step does not need to be large. One source, one dashboard or one analysis can already be enough to show value and create support.

The difference lies in how that first step is built. If connections, permissions, data models and documentation are reusable from the start, the foundation can grow with new questions.

Case study

De Klussenier: getting value from data yourself, without a large IT team

Het KlusHuis / De Klussenier is a small franchise organisation. The question: reach customers and skilled professionals more effectively with information that already exists. Datalab helped bring together the available sources from marketing, sales and customer requests and make them usable. With dashboards and self-service BI, the organisation sees patterns and opportunities in the franchise network, and the people who work with it steer on the outcomes themselves.

The case in brief

  • The question: see sales opportunities more clearly and support the franchise network more effectively.
  • The approach: start with a clear question, bring the available sources together and make the outcome usable for the people who work with it.
  • The result: dashboards and self-service BI for marketing, sales and franchise development - without a large internal IT team.
Collaboration model

Three ways to start with Datalab Studio

Datalab connects to the capacity you already have. Organisations without their own data team have Datalab build and manage the complete result; organisations with their own capacity choose co-building or just the data platform.

Optie #1

From data question to management

Datalab guides the full process: sharpen the question, unlock sources, build data models, realise dashboards or analyses, take users along and develop further. You assess goals, definitions and results.

  • Also suitable without your own data team
  • From first scan to management and further expansion
Optie #2

Foundation plus first applications

We build together with key users and technical staff. You provide source knowledge and users; results emerge immediately, while knowledge about sources, definitions and use grows inside your organisation.

  • Practical for a first data warehouse or dashboard environment
  • Suitable when adoption matters as much as technology
Optie #3

Data platform for your own team

We deliver connectors, data models, quality checks, permissions and a manageable platform, with documentation and handover. Your own team then builds dashboards, analyses or data products on top of it.

  • For organisations with their own data, IT or BI capacity
  • Clear architecture, handover and documentation

How do we make a broad data question concrete?

We do not start with technology for technology's sake, but with the decisions, processes and users for whom data needs to create value.

1.

Choose a sharp first question

We determine which question creates value first. For example faster reporting, grip on process quality, insight into capacity, better planning, more reliable KPIs or a basis for forecasting.

Resultaat: a concrete scope.

2.

Map sources and definitions

We investigate which systems, files, APIs, databases and manual steps are needed. At the same time, we define what terms mean and where data is sensitive, incomplete or ambiguous.

Resultaat: visibility of feasibility and risks.

3.

Build a reusable foundation

We set up connections, data models, permissions, quality checks and documentation so the first application does not stand alone, but can be expanded later.

Resultaat: a reliable data foundation.

4.

Make the first application usable

We deliver a dashboard, report, analysis, data product or AI preparation that connects to the workflow. Users know what they are seeing, what the figures mean and when to act. After that, the foundation grows with you: your team builds further itself or Datalab keeps building and guiding.

Resultaat: data that can be used every day.

Source types we combine

From standard packages to your own applications. Is your system missing? We investigate whether data is available via API, database or export - and what of it can be used reliably.

CRM & sales

+ other CRM and sales packages

Customers, pipeline and activities alongside delivery and invoicing.

ERP & operations

+ planning, WMS, service and production

Orders, stock, planning and costs as the backbone of the process.

Files & exports

Excel, CSV, reports and periodic deliveries

Existing spreadsheets and exports are checked and loaded repeatably - no more manual copying and pasting.

Own applications & databases

APIs, databases, event streams and custom connections

For custom software we first explore which data is available via API, database or export and what of it can be used reliably.

Datalab is a partner of

Exact
Nmbrs
Loket
Frequently asked questions

Questions about combining data and dashboards

Practical answers about starting, sources, dashboards, data warehousing, AI and collaboration.

How do we combine data from multiple systems?

We investigate the best route per system: API, database, export or custom connection. The sources then come together in one data model with recorded definitions and keys between the systems, so data from different process steps can be linked. On top of that, we build dashboards or reports for your team's questions.

When is Datalab Studio a good entry point?

When you want to combine systems and information across different process steps: automating reporting, one set of figures for all departments, or visibility of where a process slows down. The first question can be small, as long as the foundation is set up for reuse.

Do we need to know exactly which dashboard we want?

No. Often we start with a problem: figures arrive too late, reporting takes too much manual work, sources contradict each other or teams lack grip on a process. Together we translate that into a first usable application.

Can you work with custom software or technical data sources?

Yes. We first explore whether data is available via API, database, export, files or event streams, and what of it can be used reliably. What matters is that the connection remains manageable, secure and verifiable. View all sources we have already unlocked in the source catalogue.

Is this mainly a data warehouse or mainly dashboards?

Both can be part of it, but Datalab Studio is broader than one technology. It is about the foundation underneath reliable data: sources, data models, definitions, permissions, quality checks and applications such as dashboards, reports, analyses or AI.

Can employees work with the data themselves?

Yes, if that is the goal. We can set up datasets, documentation, permissions and tooling so teams can create analyses themselves in Power BI, Tableau, SQL, Python, R or other tools. At the same time, we make sure definitions and quality remain controlled.

How small can we start?

A first step can be one source, one dashboard, one dataset or one analysis. Not every data problem in the organisation needs to be solved up front: we assess the required data quality per application and make limitations and checks explicit. What deliberately follows later, we also name.

Can you also build AI applications?

Yes, but only when the data foundation is suitable for it. We help with forecasting, anomaly detection, classification, process automation or AI workflows, and look at data quality, explainability, permissions and risks. Also see Analytics & AI.

How do we prevent this from becoming a technical project that no one uses?

By working from users, decisions and workflows from the start. We clarify what figures mean, how they are used and who owns definitions and follow-up. Adoption is part of implementation, not something added afterwards.

What does Datalab Studio cost?

That depends on the number of sources, the desired applications and the division of responsibilities between your team and Datalab. Datalab works with a fixed amount that includes connectors, platform, dashboards and management; licences (such as Power BI) and consumption costs are separate. Schedule a call to determine the first step.

Which of your processes runs across multiple systems?

In a no-obligation conversation we scope a first application and determine which sources and effort it needs - including an indication of lead time and costs.

Discuss your data question